
Project overview
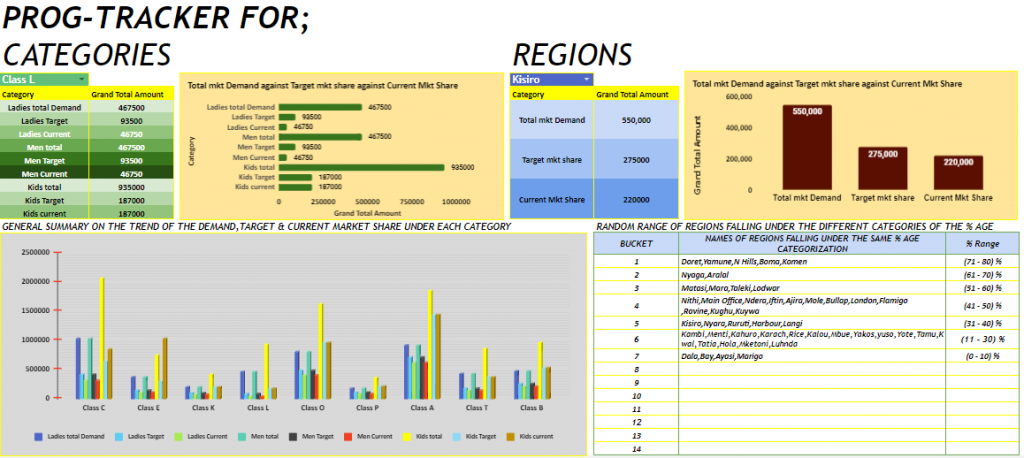
Here we want to see the deviation from the current market share and how much market share we have per region or category compared to Target market share. How is this captured in the dashboard? This is the key here because it tells where the business is generally and where each region is at a given time. It ideally informs the revenue from each stream. just to see in a glaze - this is the total market share we have and this is how each region has contributed to where we are. The current market share should be expressed as a percentage of the total market. Since the total market available for each region differs, it is important to measure the performance of a region as a percentage of either the target or the total market. A region may have a small current market share, for instance, Aralal has a current market share of 56,000 which is at 70% compared to Kisiro 220,000 but at 40%. It’s important to see the highest and lowest performers regardless of the numbers. This is also tied to the above but here we will be looking at efficiency and performance i.e. current share as a percentage of the total. Which region has what percentage of its market - tells also where are the strongest markets compared to competitors. A lower percentage shows someone else is beating us to that market(KPI).
Project details
Project name: Prog-tracking system to visually view the position of the company in terms of its market share.
Client: Brooks Reuben Kyalo.
Category: Business.
Date start: 5th July 2020
Date end: 4th Aug 2020
Tags: Finding Problems & Solutions.